
In the dynamic world of Forex trading, having a deep understanding of technical analysis tools is crucial for making informed decisions. One of the most widely used and reliable tools in this realm is the Relative Strength Index (RSI). This indicator helps traders identify overbought or oversold conditions in the market, providing valuable insights for potential entry and exit points. In this article, we will explore the RSI indicator in detail, explaining its mechanics, how to interpret it, and how you can use it to enhance your trading strategies.
The Relative Strength Index (RSI) is a momentum oscillator that measures the speed and change of price movements. It was developed by J. Welles Wilder and introduced in his 1978 book, New Concepts in Technical Trading Systems. The RSI is a popular tool among traders because it provides clear signals regarding market conditions, particularly whether a currency pair is overbought or oversold.
The RSI is calculated using the following formula:
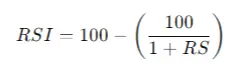
Where RS (Relative Strength) is the average gain of up periods during a specified time frame divided by the average loss of down periods during the same period. The RSI value ranges from 0 to 100, and it is typically set to a 14-day period, although traders can adjust this according to their preferences.
How to Interpret the RSI
The RSI indicator is straightforward to interpret:
- Overbought Conditions: When the RSI value exceeds 70, the asset is considered overbought. This may suggest that the price has risen too quickly and could be due for a correction.
- Oversold Conditions: When the RSI falls below 30, the asset is considered oversold, indicating that the price may have fallen too quickly and could be poised for a rebound.
- Divergences: A divergence occurs when the price of the asset and the RSI move in opposite directions. For instance, if the price is making new highs while the RSI is failing to do so, it might signal a potential reversal.
Using RSI in Your Trading Strategy
Incorporating the RSI indicator into your trading strategy can enhance your decision-making process. Below are some practical ways to use the RSI:
1. Identifying Potential Reversals
One of the primary uses of the RSI is identifying potential reversals. If the RSI crosses above the 70 level, it might indicate that the asset is overbought and a price reversal is possible. Conversely, if the RSI falls below 30, it suggests that the asset is oversold, and a price increase might be on the horizon. However, traders should always combine RSI signals with other indicators or analysis methods to confirm potential reversals.
2. Combining RSI with Support and Resistance Levels
RSI can be particularly powerful when combined with support and resistance levels. For example, if the RSI shows an overbought condition near a known resistance level, this could be a strong signal to sell. Similarly, an oversold RSI at a support level could indicate a buying opportunity. This approach adds an additional layer of confirmation, reducing the likelihood of false signals.
3. Using RSI Divergence for Trend Reversals
RSI divergence is another effective method for spotting trend reversals. When the price is trending upwards but the RSI is trending downwards (bearish divergence), it could signal a weakening trend and a potential reversal. On the other hand, if the price is falling but the RSI is rising (bullish divergence), it may indicate a strengthening market and an upcoming upward trend.
4. Dynamic RSI Settings for Different Markets
While the standard RSI setting is 14 periods, traders can adjust this to fit their trading style and the specific market conditions. For example, a shorter period RSI (e.g., 7 or 9 periods) may be more sensitive and provide more signals, making it suitable for volatile markets. Conversely, a longer period RSI (e.g., 21 or 30 periods) might be better for filtering out noise and identifying longer-term trends.
The Role of RSI in Risk Management
Risk management is a critical aspect of successful trading, and the RSI indicator can play a significant role in this area. By identifying overbought and oversold conditions, traders can make more informed decisions about where to set stop-loss orders or when to take profits. For example, in an overbought market, a trader might decide to tighten stop-loss levels to protect gains, while in an oversold market, they might loosen stop-losses to allow for potential recovery.
Additionally, traders using the RSI should be cautious of over-reliance on a single indicator. Market conditions can change rapidly, and it’s important to use RSI in conjunction with other indicators, such as moving averages or MACD, as well as keeping an eye on broader economic news that could impact the market.
How DotBig Enhances Your Trading Experience
As you explore and integrate tools like the RSI into your trading strategy, choosing the right broker is essential. DotBig forex provides an advanced trading platform that supports the use of various technical indicators, including RSI, giving traders the flexibility to customize their strategies according to their needs. With DotBig, you can access real-time data, execute trades efficiently, and utilize comprehensive educational resources to further your trading knowledge.
DotBig also offers a demo account, which is an excellent way for beginners to practice using indicators like the RSI without risking real capital. This feature allows traders to refine their strategies and build confidence before transitioning to live trading.
Unlock Your Trading Potential with RSI
Mastering the RSI indicator can significantly enhance your trading strategy, helping you to identify potential entry and exit points more effectively. By understanding how to interpret RSI signals and integrating them into a broader trading plan, you can improve your decision-making and increase your chances of success in the Forex market.
However, successful trading is not just about understanding indicators; it’s about continuous learning, disciplined risk management, and choosing the right tools and partners. With DotBig’s robust trading platform and support, you have the resources you need to maximize your trading potential.
So, whether you are a novice or an experienced trader, incorporating RSI into your trading toolkit, along with the comprehensive services offered by DotBig, can set you on the path to achieving your trading goals.